Mapping Water Stress and Agricultural Adaptation Potential Using Multi-Source 16-Band Attention U-Net: Case of Taroudant, Morocco
Abstract
Water scarcity is a critical challenge in the Souss-Massa region of Morocco, particularly in agricultural areas where traditional monitoring methods such as field visits are time-consuming and resource-intensive. Standard vegetation indices like NDVI often fail to capture the complexity of root-zone moisture stress, which is crucial for effective water management. This research introduces a novel Multi-Modal Attention U-Net architecture that integrates 16 spectral and environmental bands from multiple data sources to achieve precise agricultural land segmentation and water stress mapping. The model fuses optical imagery from Sentinel-2, radar data from Sentinel-1, soil moisture measurements from SMAP, and topographic data including Digital Elevation Models (DEM), slope, and precipitation patterns. By leveraging an attention mechanism, the network learns to focus on the most informative features for water stress detection. A weak supervision pipeline was developed on Google Earth Engine to generate training labels, enabling the model to achieve 93.6% accuracy and a Mean Intersection over Union (IoU) of 0.81 in segmenting agricultural areas and identifying water stress zones. The methodology has been applied to the Taroudant region in Morocco, demonstrating its practical utility for real-world water resource management and agricultural planning. The research contributes to advancing remote sensing techniques for environmental monitoring in water-scarce regions.
Figures
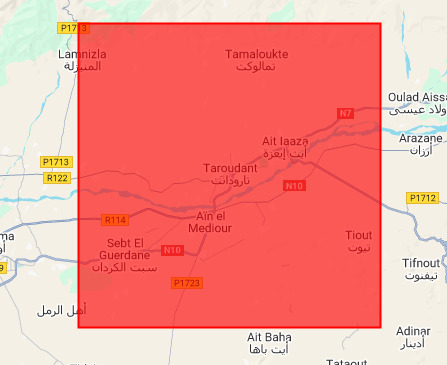
Figure 1: Study area in Taroudant region, Souss-Massa, Morocco
Geographic location and extent of the study area showing agricultural lands in the Taroudant region of Morocco. The area is characterized by semi-arid climate and intensive agricultural activities.
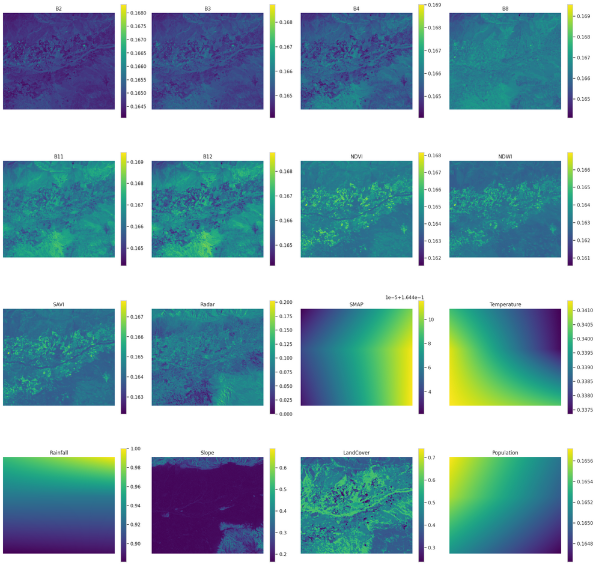
Figure 2: Multi-source remote sensing data integration
Visualization of the 16-band data fusion approach combining Sentinel-1 radar (VV, VH polarizations), Sentinel-2 optical bands, SMAP soil moisture, DEM, slope, and precipitation data.
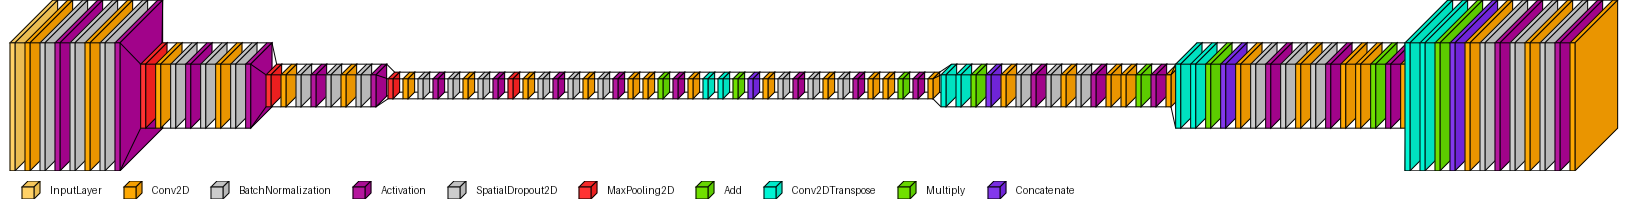
Figure 3: Attention U-Net architecture diagram
Detailed architecture of the Multi-Modal Attention U-Net model showing encoder-decoder structure with skip connections and attention gates that help the network focus on relevant features for water stress detection.

Figure 4: Water stress mapping results
Classified water stress map showing different levels of agricultural water stress across the study area. Color-coded regions indicate varying degrees of water stress from low (green) to severe (red).
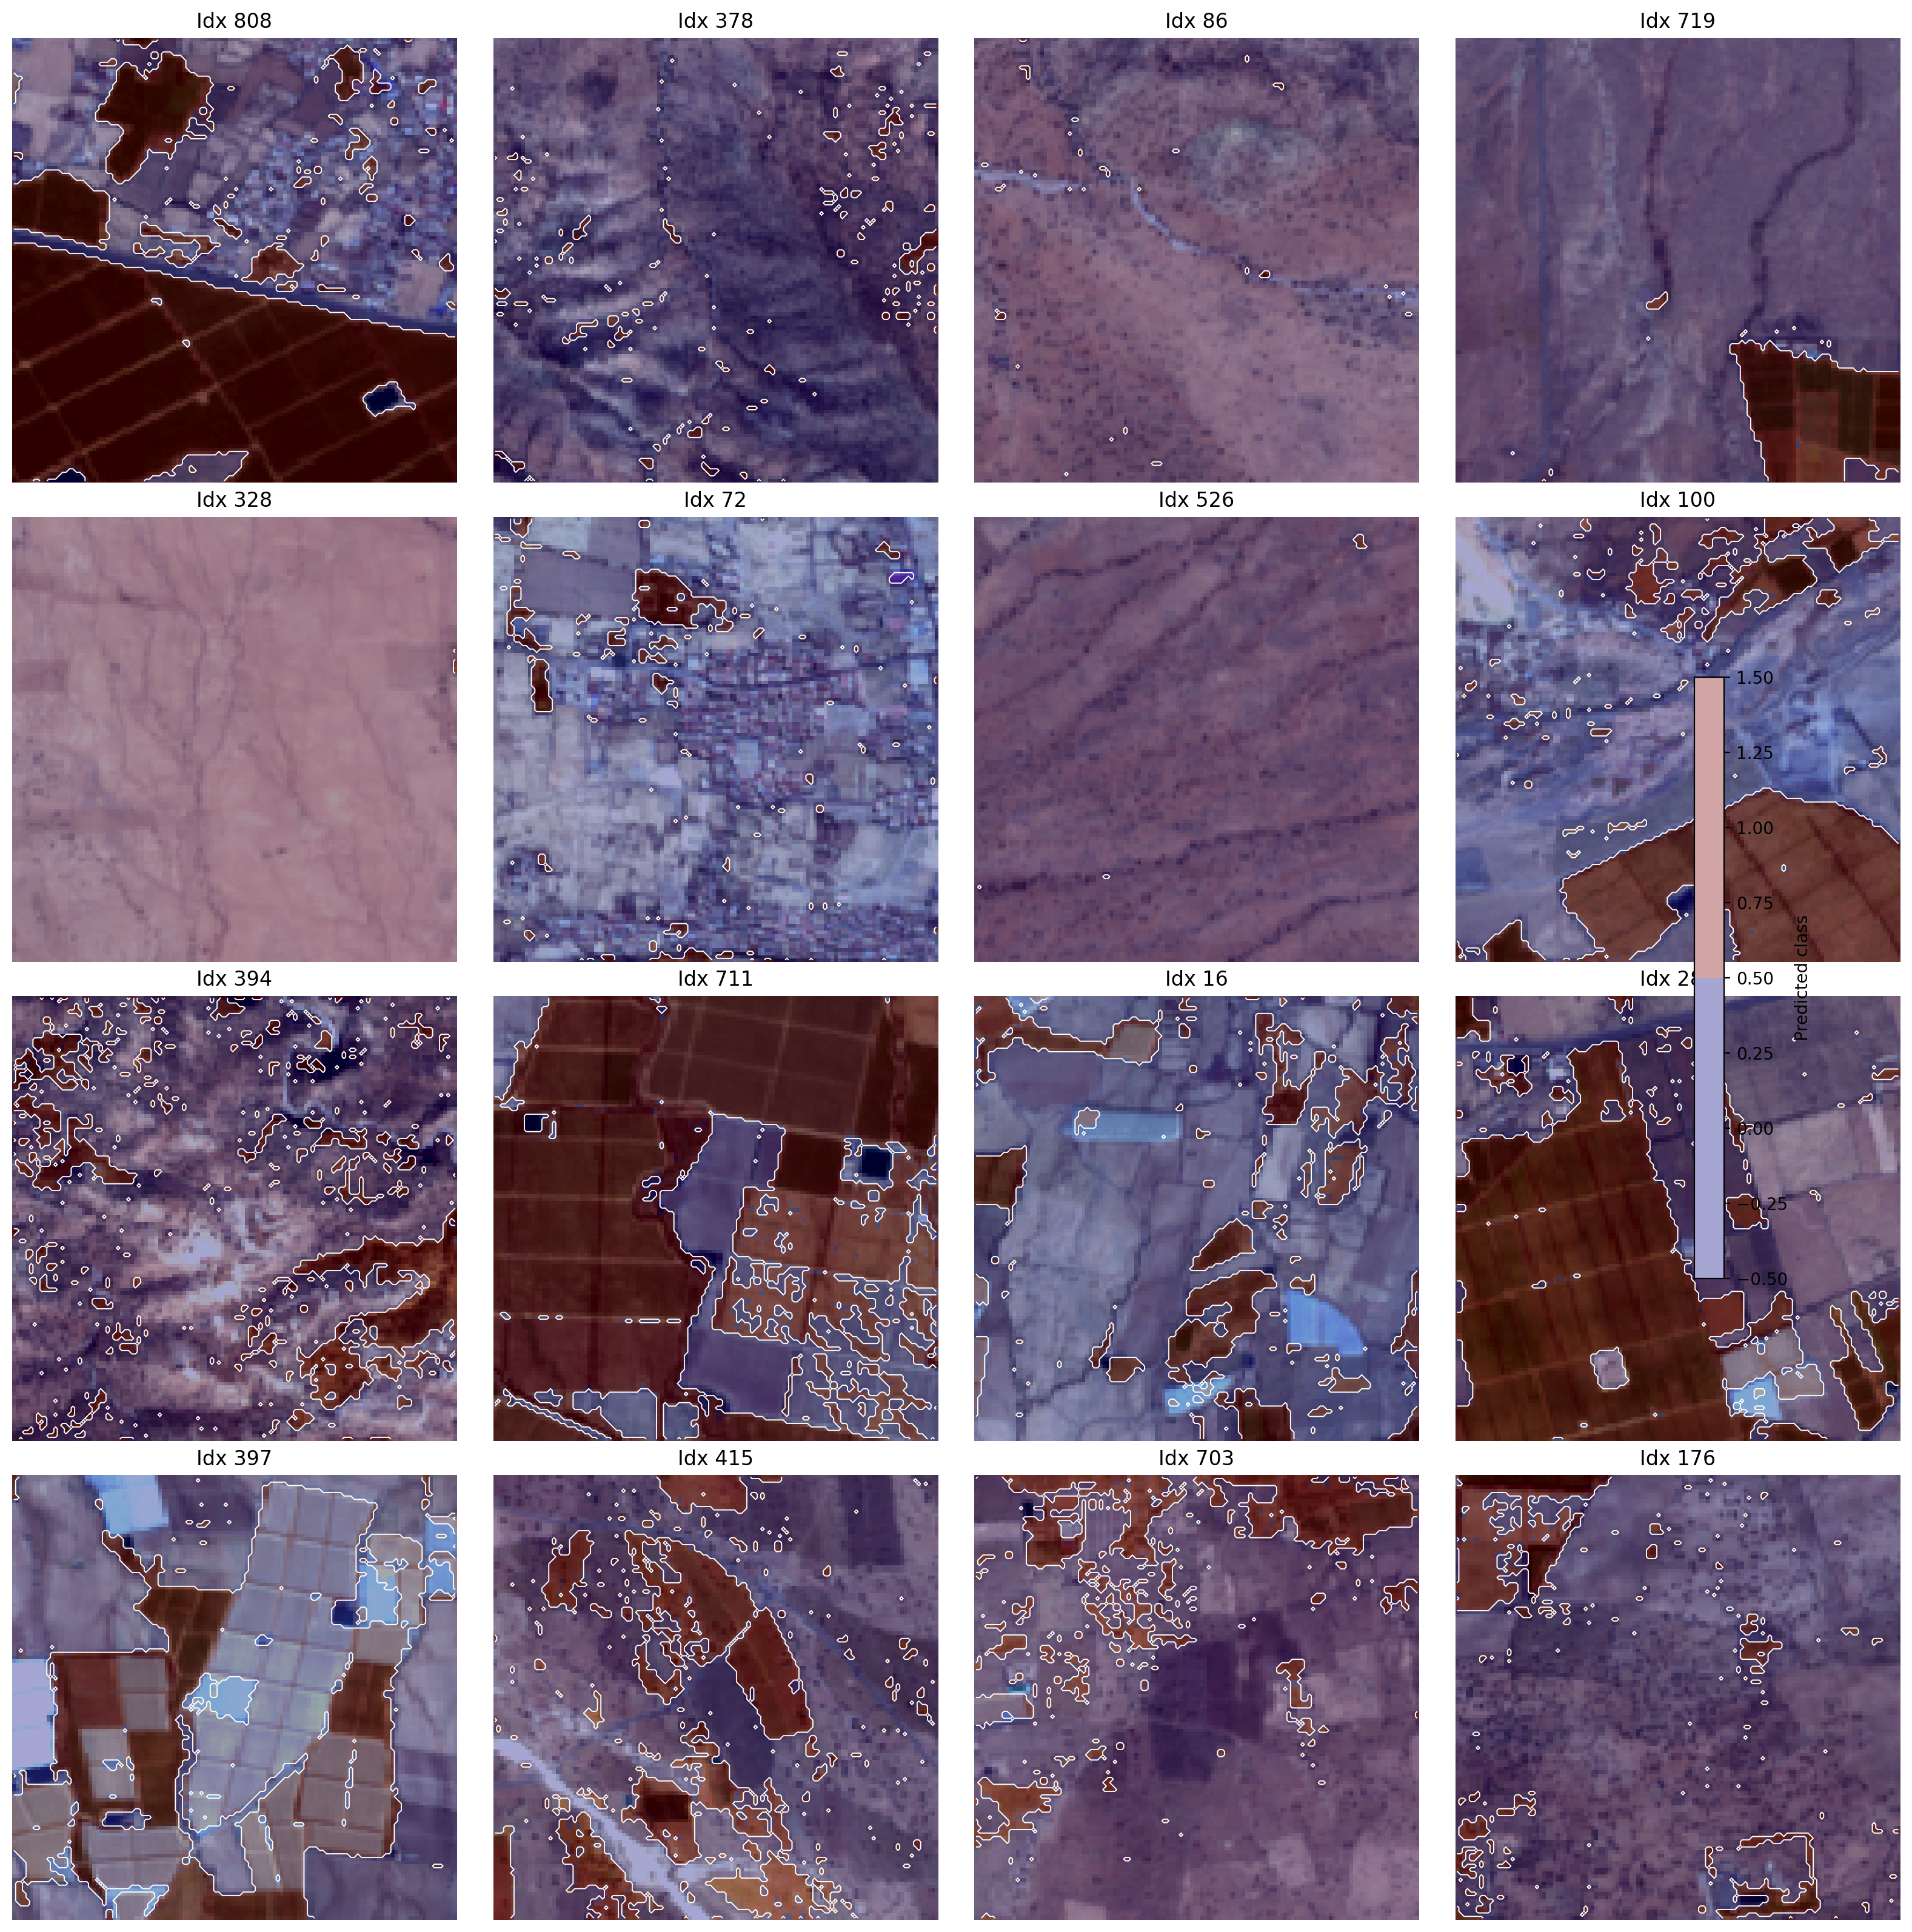
Figure 5: Agricultural land segmentation results
Comparison of ground truth and model predictions for agricultural land segmentation. The model achieves 93.6% accuracy with Mean IoU of 0.81.
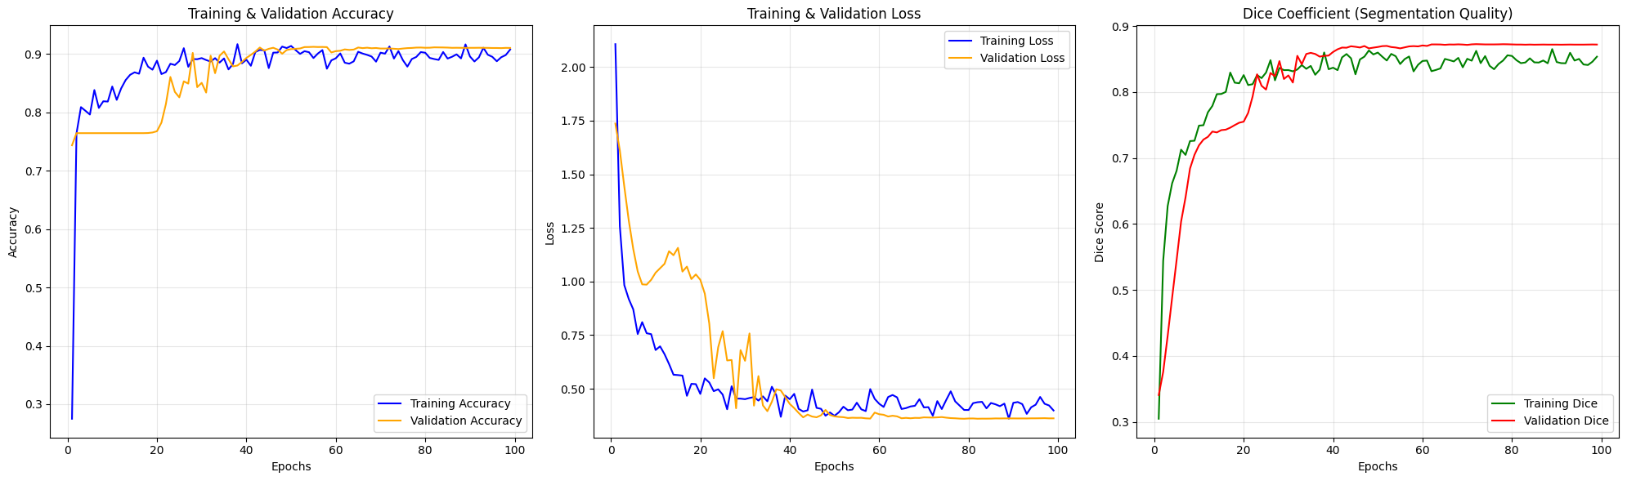
Figure 6: Model performance metrics and validation results
Quantitative evaluation showing accuracy, precision, recall, F1-score, and IoU metrics across different validation sets. Confusion matrix and loss curves demonstrate model convergence and reliability.
PDF Preview
Embedded viewer restored with improved contrast and background styling.
References
- Ronneberger, O., Fischer, P., & Brox, T. (2015). U-Net: Convolutional Networks for Biomedical Image Segmentation. In Medical Image Computing and Computer-Assisted Intervention (MICCAI) (Vol. 9351, pp. 234-241). Springer.
- Oktay, O., Schlemper, J., Folgoc, L. L., Lee, M., Heinrich, M., Misawa, K., ... & Rueckert, D. (2018). Attention U-Net: Learning Where to Look for the Pancreas. arXiv preprint arXiv:1804.03999.
- European Space Agency. (2023). Sentinel-1 SAR Technical Guide. ESA Earth Online.
- European Space Agency. (2023). Sentinel-2 MSI Technical Guide. ESA Earth Online.
- Entekhabi, D., Njoku, E. G., O'Neill, P. E., Kellogg, K. H., Crow, W. T., Edelstein, W. N., ... & Van Zyl, J. (2010). The Soil Moisture Active Passive (SMAP) Mission. Proceedings of the IEEE, 98(5), 704-716.
- Gorelick, N., Hancher, M., Dixon, M., Ilyushchenko, S., Thau, D., & Moore, R. (2017). Google Earth Engine: Planetary-scale geospatial analysis for everyone. Remote Sensing of Environment, 202, 18-27.
- Gao, B. C. (1996). NDWI—A normalized difference water index for remote sensing of vegetation liquid water from space. Remote Sensing of Environment, 58(3), 257-266.
- Rouse, J. W., Haas, R. H., Schell, J. A., & Deering, D. W. (1974). Monitoring vegetation systems in the Great Plains with ERTS. NASA Special Publication, 351(1974), 309.
- Ministry of Agriculture, Fisheries, Rural Development, Water and Forests - Morocco. (2020). National Irrigation Water Saving Program 2020-2027.
- World Bank. (2022). Morocco Country Climate and Development Report. World Bank Group.